
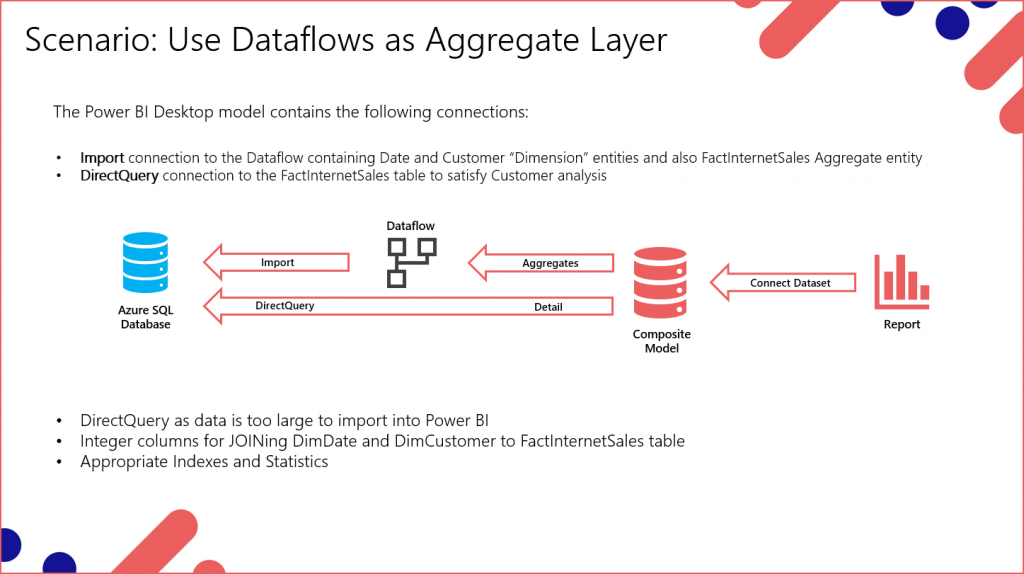
Power BI Aggregations provide a way to query a data source that is too large to fit within a Power BI dataset by allowing an imported aggregates table to satisfy certain calculations whilst other calculations can fall back to using a live (DirectQuery) connection to the underlying data source. This is known as a Composite Model. In this scenario-based blog post we’ll create a Power BI solution which analyses sales data where the source data is considered too large to fit within a Power BI dataset. E.G. if the underlying data source Fact table at the Order Date and Customer granularity exceeded limits for a Power BI Desktop model, the model can be setup to use the Order Date as an aggregate and the Customer as a live connection. When a report viewer uses Order Date and an appropriate calculation in a report, this can be satisfied with the imported cache, whilst using Customer will result in a connection to the underlying data source.
Scenario Overview
The scenario will comprise several steps.
- Create a Power BI Service Dataflow to import 2 tables used as Dimension tables and create 1 Internet Sales Aggregate table from an Azure SQL Database.
- Create a Power BI Desktop model which imports from the Dataflow and also connects in DirectQuery to the Azure SQL Database.
- Create Aggregations in the Power BI Desktop model using the Internet Sales Aggregation aggregate table.
- Create a report and test aggregations.
Solution Video
The following video is based on the contents of this blog post, which will go through creating the solution.
Walkthrough
Prerequisites
To follow along with this walkthrough you’ll need a Power BI Pro account (Premium is not required) with the November 2020 release of Power BI Desktop and an Azure SQL Database. CSV data files are available here for you to import into your Azure SQL Database using SQL Server Management Studio. However, you can follow along with your own data.
Create Dataflow
We’ll first create a Dataflow to import the data from the Azure SQL Database and create an entity which will be used for the aggregate table.
- Login to https://app.powerbi.com.
- Create a new Workspace called Data Flow Aggregates.
- Create a new Dataflow by selecting New > Dataflow and selecting Add New Entities.
- Select Azure SQL Database and enter appropriate server, database and security information.
- Select the DimDate, DimCustomer and FactInternetSales table.
- Select Transform Data.
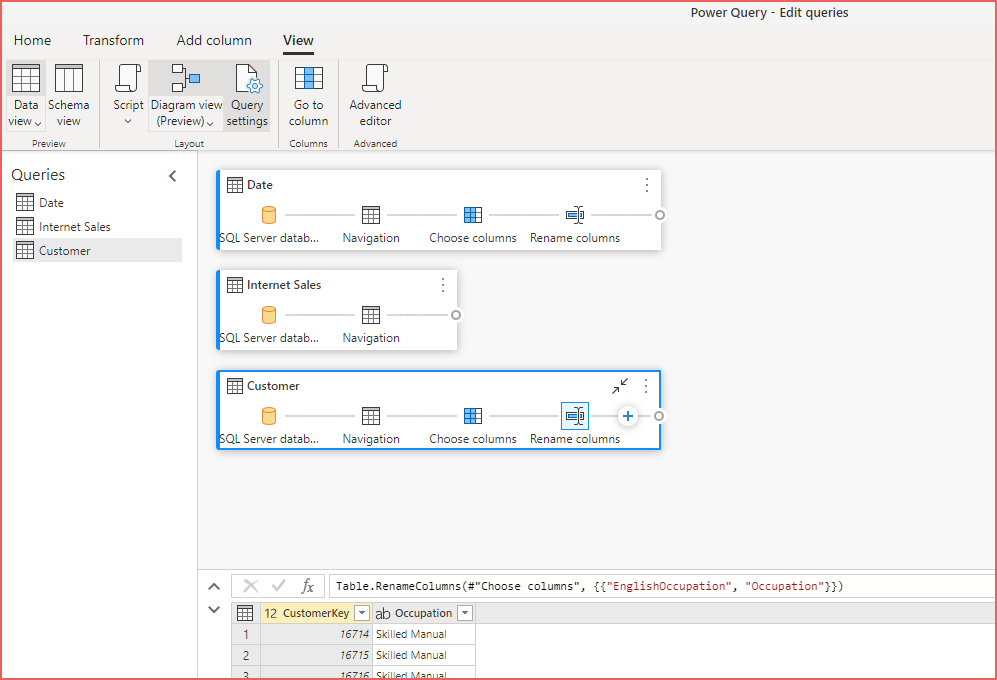
- Rename DimDate table to Date.
- Rename DimCustomer to Customer.
- Rename FactInternetSales table to Internet Sales Aggregation.
We’ll now switch to the new Diagram View in the Dataflow Power Query window to complete the next steps.
Transform Date Entity
- Select View in the Power Query menu and select Diagram View.
- On the Date entity, select the expand icon (diagonal arrows), a plus icon should appear on the right of the entity.
- Select the plus icon and under Manage columns, select Choose columns.
- Select Select All to unselect all columns, then select the following:
- DateKey
- FullDateAlternateKey
- EnglishMonthName
- MonthNumberOfYear
- CalendarQuarter
- CalendarYear
- Select OK.
- In the preview table pane under the entities, double-click the following columns and rename:
- FullDateAlternateKey = Date
- EnglishMonthName = Month
- CalendarQuarter = Quarter
- CalendarYear = Year
- Select the DateKey column, select the plus icon on the entity in the diagram (expand if necessary) and under Transform any column, select Mark as key.
Transform Customer Entity
- On the Customer entity, select the expand icon (diagonal arrows), a plus icon should appear on the right of the entity.
- Select the plus icon and under Manage columns, select Choose columns.
- Select Select All to unselect all columns, then select the following:
- CustomerKey
- EnglishOccupation
- Select OK.
- In the preview table pane under the entities, double-click the following columns and rename:
- EnglishOccupation= Occupation
- Select the CustomerKey column, select the plus icon on the entity in the diagram (expand if necessary) and under Transform any column, select Mark as key.
Transform Internet Sales Entity
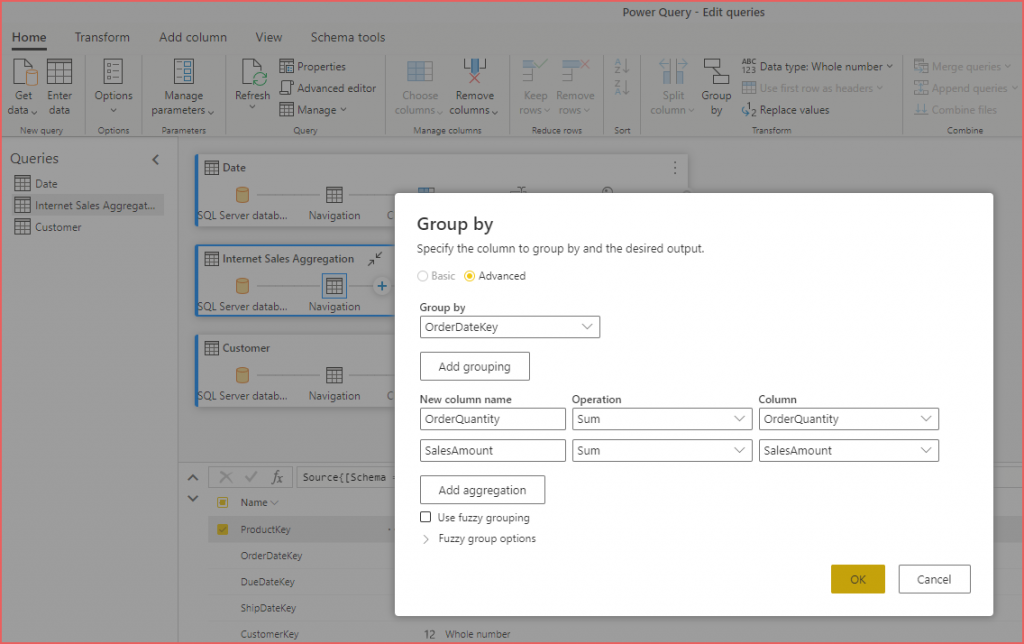
- On the Internet Sales Aggregation entity, select the expand icon (diagonal arrows), a plus icon should appear on the right of the entity.
- Select the plus icon and under Transform table, select Group by.
- Select the Advanced option.
- Select OrderDateKey in the Group by drop-down box.
- Enter OrderQuantity in the New column name textbox, select Sum as the Operation and select the OrderQuantity column under Column.
- Click Add aggregation
- Enter SalesAmount in the New column name textbox, select Sum as the Operation and select the SalesAmount column under Column.
- Select OK.
- Select the OrderQuantity column and ensure the data type is set to Whole number by selecting the data type icon to the left of the column name.
- Select the SalesAmount column and ensure the data type is set to Currency.
- Finally, select Save and Close and enter Internet Sales Data as the Dataflow name and click Refresh Now when prompted.
The Dataflow is now ready to use in Power BI Desktop.
Create Power BI Desktop Data Model
In this stage we’ll create a Power BI Desktop model using the new Dataflow, create a DirectQuery connection to the Azure SQL Database and create aggregations.
Create Basic Model
- Open Power BI Desktop.
- On the Home menu, select Get Data > Power BI dataflows.
- Expand the Data Flow Aggregates workspace and expand the Internet Sales Data dataflow.
- Select the Date, Customer and Internet Sales Aggregation entity by ticking the checkboxes.
- Click Transform Data as there is one property we need to modify, which is to change the data type of the Internet Sales.SalesAmount column to Currency (Fixed decimal number). Click Close and Apply on the Power Query window.
- Click the Model view on the left-hand side and if prompted to Upgrade now to the new model view, click Upgrade now.
- Ensure the following fields have their Summarize by option set to None (show the option by selecting a field > Properties pane > Advanced > Summarize by)
- Date
- DateKey
- MonthNumberOfYear
- Quarter
- Year
- Customer
- CustomerKey
- Internet Sales Aggregation
- OrderDateKey
- Date
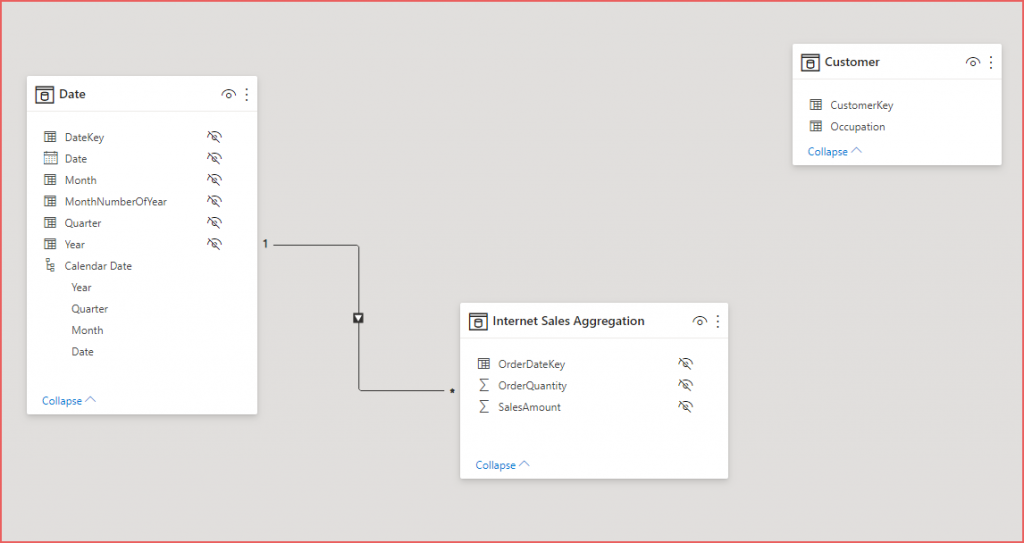
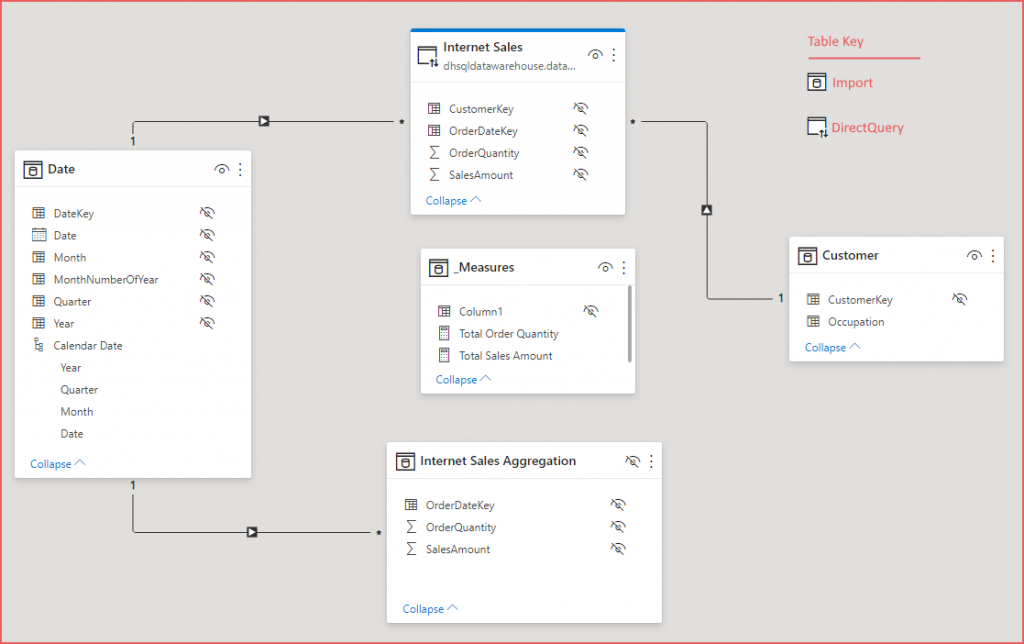
- Create a relationship between the Date and the Internet Sales Aggregation tables by selecting and dragging the DateKey column from Date to the OrderDateKey column in the Internet Sales table. Double-click the relationship and ensure that the Cross filter direction is set to Single and the Cardinality is set to One to many. This ensures that if in the future the aggregates table is changed to include another key column that the relationship will not become invalid due to the initial relationship being set as one to one.
- Ensure that all columns (yes, all columns!) are set to Hidden (right-click field and select Hide in report view). You can Ctrl-click each column then right-click > Hide in report view.
- Select the Date.Month column and in the Properties pane under the Advanced section, ensure the Sort by column dropdown box is set to MonthNumberOfYear.
- Create a hierarchy in the Date table by right-clicking the Year column in the Date table within the Fields pane on the right-hand side and selecting Create hierarchy.
- Drag the Quarter, Month and Date into the new hierarchy and rename to Calendar Date.
- Select the Data view on the left-hand side, ensure the Date table is selected and select the Mark as date table under Table tools. Select the Date column and click OK.
Add DirectQuery Table to Model
We’ll now connect to the Azure SQL Database in DirectQuery (live connection) mode and select the FactInternetSales table.
- On the Home menu, select Get Data > More > Azure > Azure SQL Database.
- Click Connect and enter appropriate server and database information, ensure DirectQuery mode is selected under Data Connectivity Mode then click OK.
- Select the FactInternetsales table and click Transform Data.
- In the Power Query window, rename the table to Internet Sales.
- On the Home menu, select Choose Columns, untick Select all columns then tick (enable) the following columns:
- OrderDateKey
- CustomerKey
- OrderQuantity
- SalesAmount
- Select Close and Apply.
- In the Model view ensure that all columns in the new Internet Sales table are hidden.
- Create a relationship between the Date.DateKey and Internet Sales.OrderDateKey column. Refer to the steps in the Create Basic Model section.
- Create a relationship between the Customer.CustomerKey and Internet Sales.CustomerKey column.
Add Aggregations to Model
We’ll now use the imported Internet Sales Aggregation table as the aggregations table and set the detail table to the DirectQuery Internet Sales table.
- In the Model view, select the elipsis (or right-click) on the Internet Sales Aggregation table and select Manage aggregations.
- Ensure that Internet Sales Aggregation is selected in the Aggregation table dropdown menu and set the aggregation options as follows:
| Aggregation Column | Summarization | Detail Table | Detail Column |
| OrderDateKey | GroupBy | Internet Sales | OrderDateKey |
| OrderQuantity | Sum | Internet Sales | OrderQuantity |
| SalesAmount | Sum | Internet Sales | SalesAmount |
This will now set the Internet Sales Aggregations table to hidden in the report view.
Create Measures
We can now create Measures which will calculate over the DirectQuery Internet Sales table, if the report query can be satisified by the aggregations table then that will be used, otherwise a live connection will be made to the data source( Azure SQL Database) to satisfy the report query.
- In the Model view, on the Home menu, select Enter data.
- Enter _Measures as the new table name and click Load.
- Ensure the default column Column1 is set to hidden in report view.
- Select the Data view, right-click the _Measures table in the Fields pane on the right-hand side and select New Measure.
- Enter Total Order Quantity:= SUM(‘Internet Sales'[OrderQuantity]) as the DAX calculation and select the comma icon in the Formatting pane to set thousands formatting.
- Add another new measure with Total Sales Amount = SUM(‘Internet Sales'[SalesAmount]) as the calculation and select the currency symbol > £ English (United Kindom) in the Formatting pane.
Create Data Visualisations and Test Aggregations
Now that the model is in place with aggregations, we can create a report and perform a simple check to see if the report query is being satisifed with the aggregations or the live data source.
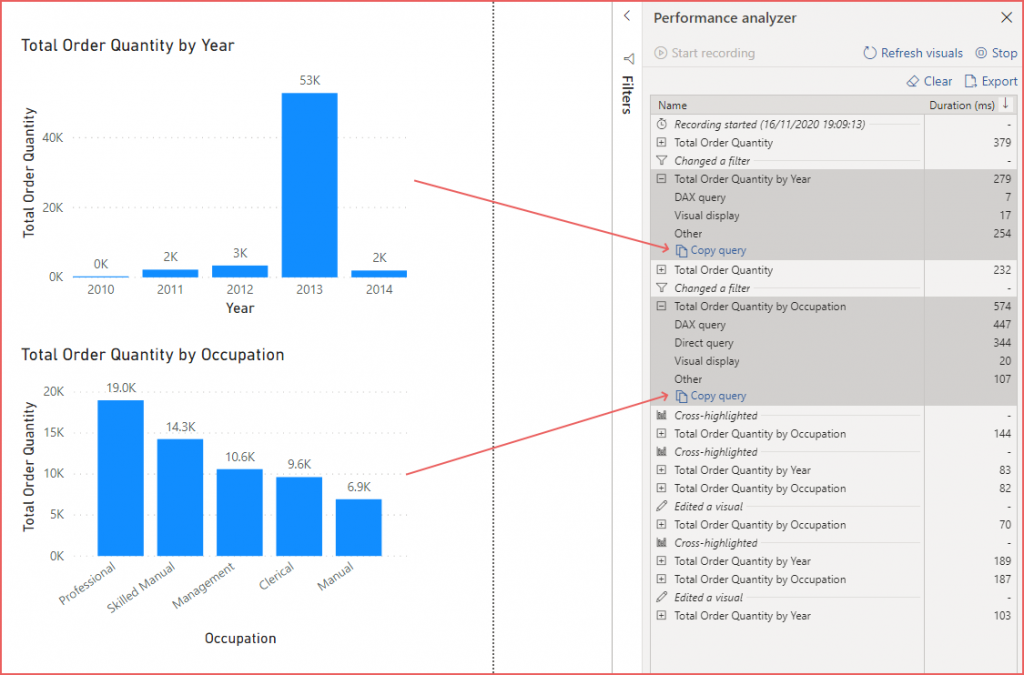
- Select the Report view, then the View tab in the top menu and select Performance Analyzer.
- In the Performance Analyzer pane on the right-hand side, select Start Recording.
- In the Fields pane, tick the Total Order Quantity measure in the _Measures table. This will create a default column chart visual.
- With the column chart selected, tick the Calendar Date hierarchy in the Date table to add the Date dimension to the column chart.
- In the Performance Analyzer pane, expand the Total Order Quantity by Year query name and select Copy Query.
- Open a text program such as Notepad and paste the query in. The query contains a DAX expression, note that there is no SQL statement present as the query is being satisified from the imported aggregation table.
- Now create a new column chart using the Total Order Quantity measure with the Occupation column from the Customer table.
- In the Performance Analyzer pane, expand the Total Order Quantity by Occupation query name and select Copy Query.
- Paste the query into the text editor. The query contains a DAX expression and also note that there is a SQL statement as the query is being satisified from the live connection and not the aggregation table.
Conclusion
In this scenario we have created a Power BI solution which includes a reusable Power BI Service Dataflow containing Dimension tables and an Aggregated table which is then used as an imported data source for a Power BI Desktop model. The Power BI Desktop model then incorporated a DirectQuery connection to an Azure SQL Database which allowed a query using the Customer dimension to be satisfied using a live connection whilst a query using the Date dimension could be satisfied with the impored aggregation table.
DirectQuery Considerations
Although DirectQuery is a feature allowing you to connect to a compatible data source in real-time, there are considerations when using this method of connectivity.
- Load on Data Source – For each query that cannot be satisifed by the imported data model, a query or set of queries must be sent to the underlying data source, this could cause contention in the system as Power BI is making live connections.
- Security Implications – Data from multipe sources may be visible to each data source as the results from a query from one data source may be sent to another data source.
- Limited Data Transformations – Certain data transformation operations with Power Query are disabled when using DirectQuery.
References
- https://docs.microsoft.com/en-us/power-bi/transform-model/desktop-aggregations
- https://docs.microsoft.com/en-us/power-bi/connect-data/desktop-directquery-about
- https://docs.microsoft.com/en-us/power-bi/transform-model/dataflows/dataflows-introduction-self-service
- https://powerbi.microsoft.com/en-us/blog/announcing-visual-data-prep-public-preview-diagram-view-in-power-query/
- https://docs.microsoft.com/en-us/power-bi/transform-model/desktop-composite-models