Power BI Desktop is a powerful and critical component in the Power BI ecosystem, it allows data from multiple sources to be ingested, cleansed, transformed, modelled for business analysis, and visualised in a range of chart types. However, this power has some drawbacks in that the whole data pipeline is handled in a single .pbix file and is not optimised for reusability. The Power BI Desktop report can be deployed to the Power BI Service and further reports built from the data model, however this is only one part of the process.
What happens when other Power BI users in the organisation are creating similar reports? Connecting to the same data sources and performing the same data cleansing and modelling processes? Duplication, inefficiency and complexity can creep in to any Power BI environment however large or small.
In this blog post we’ll go through the steps to transform a single Power BI Desktop file into multiple components including a single Dataflow, a single Dataset, and 2 Thin Reports. The initial example report contains 2 report pages for Internet Sales and Reseller Sales, we will break out the report pages into seperate reports but we will still use a single dataset and a single data load (Dataflow).
Power BI Desktop Conversion to Separate Components Workflow
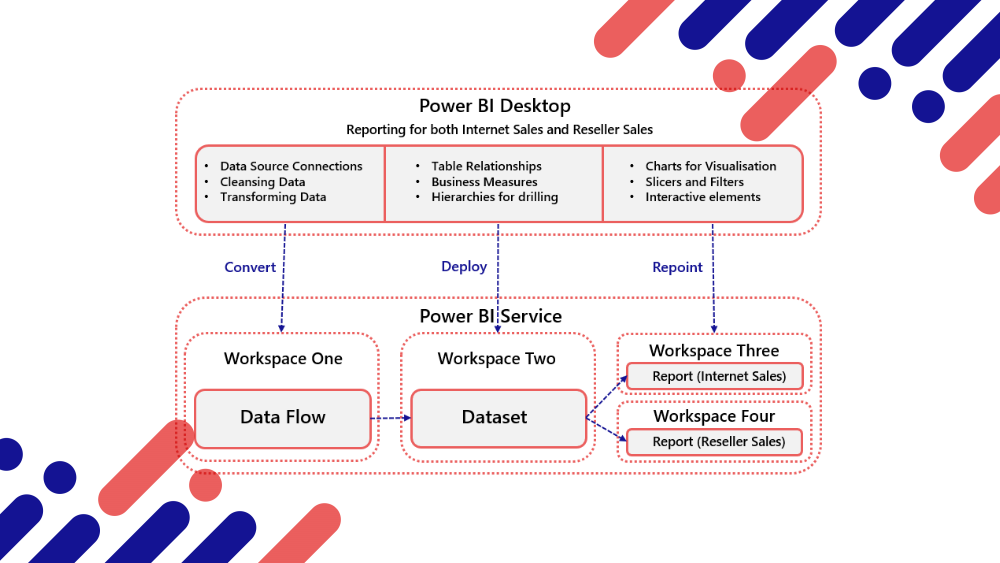
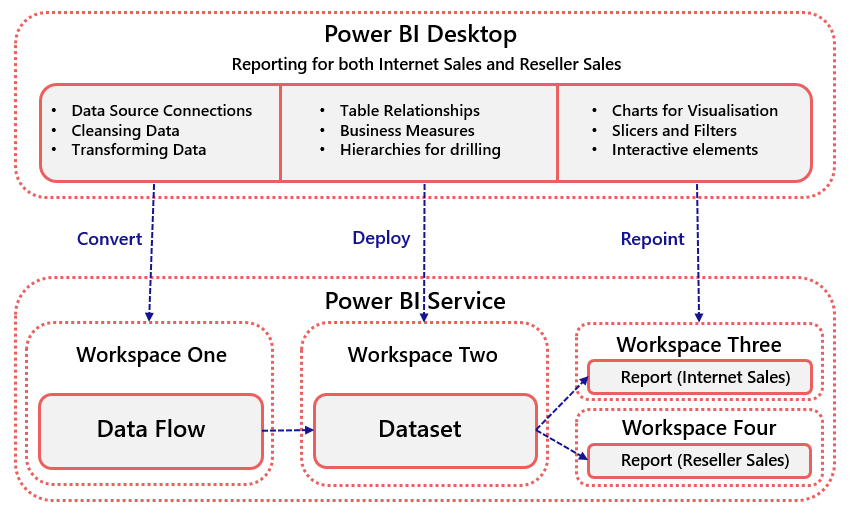
The following diagram shows that the 3 main steps within Power BI Desktop will be separated into 3 components in the Power BI Service.
- Dataflow: This is Power Query Online which can be used to connect to data sources and transform/cleanse data using the M language.
- Dataset: This is the data model containing the table relationships and business measures using DAX but does not contain any data visualisations.
- “Thin” Reports: These are reports which connect to the Dataset and do not contain the data themselves.
Why Create Separate Power BI Components?
- Reduce loading on data sources – By creating Dataflows we can reduce the load on data sources by centralising the source data loading and transformation process.
- Reduce duplication of data cleansing and transformation logic – By centralising the data transformation logic we can remove duplicate logic from Power BI Desktop reports. If logic needs to change in multiple reports then this can be difficult to manage and ensure consistency.
- Reduce complexity if multiple dataset are in use – Reducing the number of duplicated datasets that are in use in the Power BI Service can simplify the overall architecture ensuring greater user experience when searching for data.
Walkthrough
We’ll now go through the following steps.
- Prerequisites & Download Files
- Create Workspaces in Power BI Service
- Create Data Flow from Power BI Desktop M Scripts
- Connect Power BI Model to Data Flow
- Create and Deploy Shared Dataset
- Connect Power BI Desktop Reports to Shared Dataset
Prerequisites & Download Files
You should be familiar with using Power BI Desktop and connecting to data using Power Query however there is no prerequisite to write M or DAX code. A Power BI Pro licence and an appropriate storage location for the source files. In this blog post we will use Azure Blob Storage. However, if you have a Power BI Desktop report you wish to convert then please follow along with the walkthrough as the data contained within the report is simply for demonstration purposes.
Download the example Sales Analysis.pbix Power BI Desktop report and the source CSV files from here. The CSV files have been generated from the Microsoft AdventureWorksDW sample database. In order to use the example report you must have an Azure Storage account to upload the files to and amend the AzurePath parameter in the report.
Create Workspaces in Power BI Service
To hold the separate components, 4 Workspaces need creating in the Power BI Service.
- Enterprise Data Flows
- Enterprise Datasets
- Enterprise Internet Sales Reports
- Enterprise Reseller Sales Reports
Create Dataflow from Power BI Desktop M Scripts
We need to create an empty Data Flow in the Power BI Service then copy the Power Query “M” objects from the Power BI Desktop file to the new Data Flow.
Power BI Desktop
- Open the Sales Analysis.pbix report (or your own report) in Power BI Desktop.
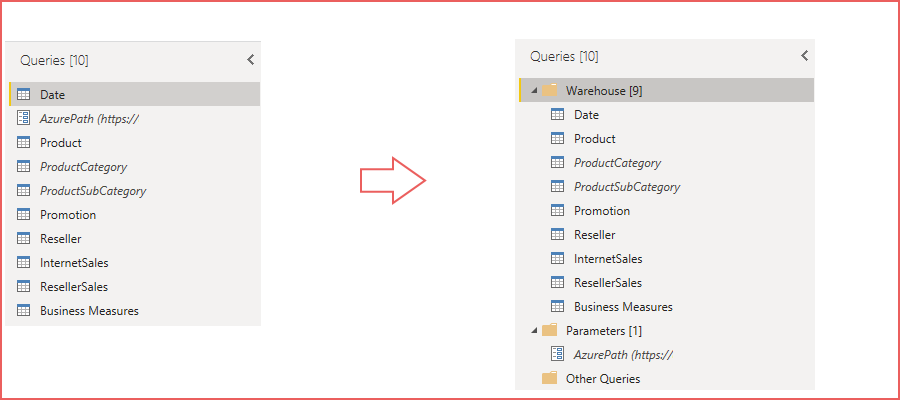
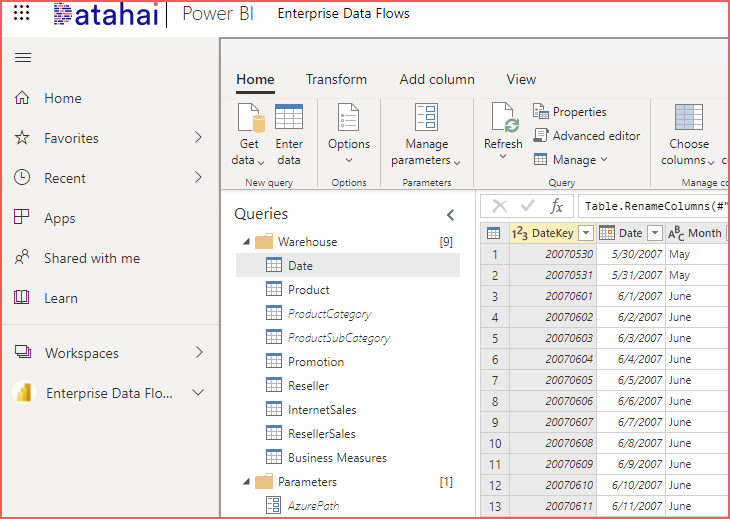
- On the main menu ribbon, select Home > Transform Data (Power Query). Note that there are 10 objects (9 Tables and 1 Parameter).
- To bulk copy we must create folders to group the queries together, which is a recommended practice regardless.
- In the Queries pane on the left side, right-click in an empty area and select New Group and call this Warehouse.
- Create another New Group and call this Parameters
- Select all the tables (Ctrl-select) and drag-and-drop into the Warehouse group.
- Select the AzurePath parameter and drag-and-drop into the Parameters group.
- Save the report and keep Power BI Desktop open.
Dataflow in Power BI Service
- Open a web browser and login to the Power BI Service at https://app.powerbi.com
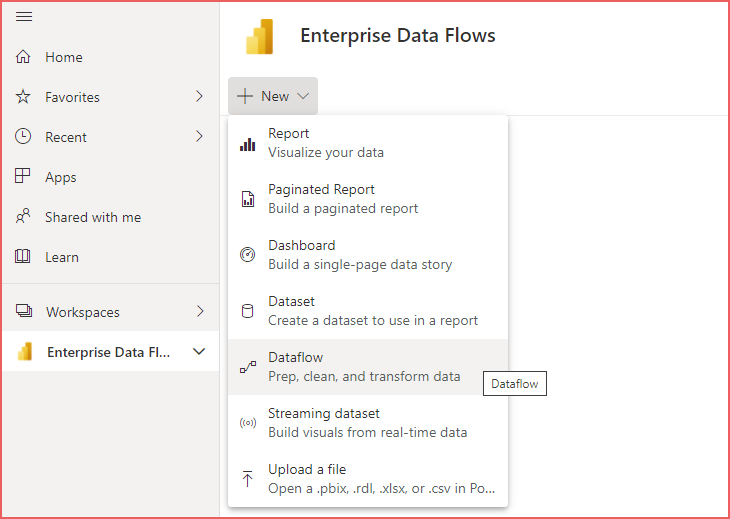
- Select the Enterprise Data Flows Workspace, select New > Dataflow
- Select Add new entities
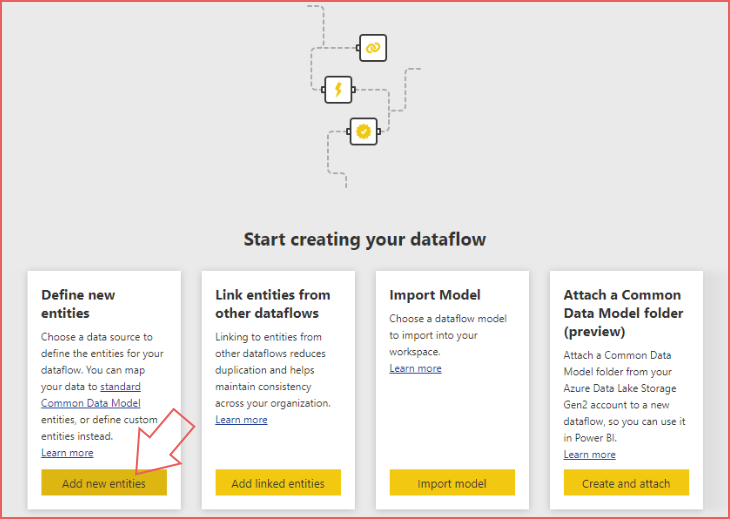
- Select Blank query (other) then in the subsequent screen, click Next (bottom right).
- Right-click the single (ABC) Query in the Queries pane and select Delete.
- Switch back to Power BI Desktop and in Transform Data (Power Query) area, select the Warehouse and Parameters folders (Ctrl-select)
- Right-click and select Copy
- Switch back to the web browser and in the Dataflow Power Query window, left-click the Queries pane (to focus) then you must Ctrl-V to paste the folders. This will copy all the tables and parameter objects into the Query pane.
- Note that the ProductCategory and ProductSubCategory tables have their loads disabled, their attributes are included in the Product table.
- In this example as we are connecting to Azure Storage, a message appears stating Please specify how to connect. Select Configure Connection and enter the appropriate details, in this case it is an Account Key.
- Once connection to the source file has been established, click Save and Close in the bottom-right corner.
- Save the Dataflow as Sales Analysis Dataflow and when prompted click Refresh now.
Connect Power BI Model to Data Flow
Once the Dataflow has been created and refreshed in the Power BI Service, we must connect to the Dataflow from within Power BI Desktop.
- Switch back to the Power BI Desktop Sales Analysis.pbix file
- From within the Transform Data (Power Query) area create a New Group called Dataflow in the Queries pane.
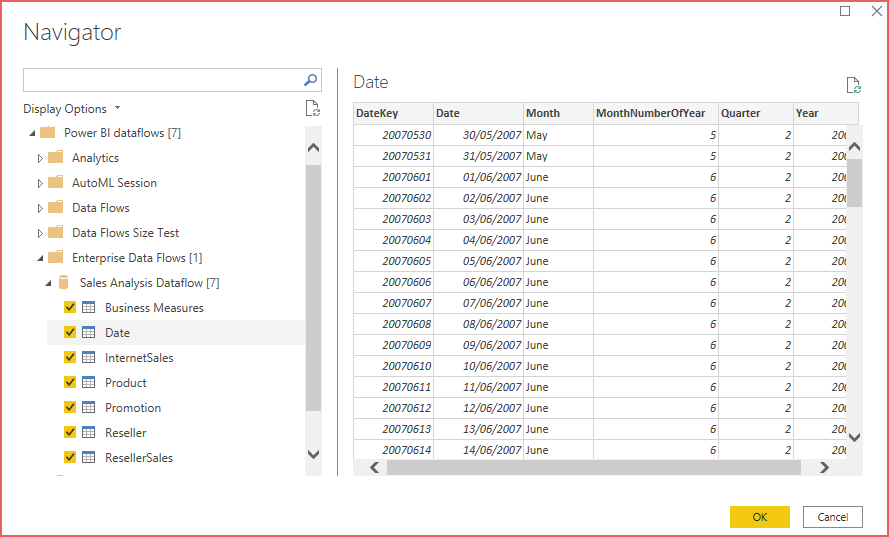
- With this new folder selected, on the Home menu select New Source > More > Power Platform > Power BI dataflows
- Expand the Enterprise Data Flows > Sales Analysis Dataflow folders and select the available 7 tables then click OK.
The 7 tables should now appear in the Dataflow folder all appended with (2) due to the name already existing. We must now copy the M code from the new Dataflow tables into the existing tables by doing the following.
- Right-click the first table (Business Measures) in the Dataflows folder and select Advanced Editor.
- Select all the code and copy (right-click > copy or Ctrl-C) then click Done.
- In the correspending table under the Warehouse folder, right-click and select Advanced Editor and paste the new code (overwrite the existing code).
- Repeat the 3 steps above for each of the other 6 tables.
- Once the existing tables code has been overwritten, delete the new Dataflows folder as it is no longer required.
- Delete the Parameters folder as this is no longer required.
- Delete the ProductCategory and ProductSubCategory tables in the Warehouse folder as they are no longer required.
- On the Home menu, click Close & Apply.
Create and Deploy Shared Dataset
- Save and close the Sales Analysis.pbix Power BI Desktop report.
- Create a copy of the Sales Analysis.pbix and rename to Sales Analysis Dataset.pbix
- Open the new Sales Analysis Dataset.pbix file in Power BI Desktop.
- Delete the 2 report pages Internet Sales and Reseller Sales.
- On the Home menu, select Publish and select the Enterprise Datasets Workspace.
- Open a web browser and login to https://app.powerbi.com and open the Enterprise Datasets Workspace
- Select the All tab and note there are 2 objects, a report and a dataset. Delete the report (blue chart icon) by hovering over the report name and selecting the elipsis to the right, select Delete.
- We can Promote the dataset by hovering over the dataset name, selecting the elipsis and selecting Settings.
- Expand Endorsement and select Promoted.
- Enter “Reseller Sales and Internet Sales Data Model” in the Description textbox.
- Click Apply.
Connect Power BI Desktop Reports to Shared Dataset
Now that the dataset has been deployed to the Power BI Service, we can create “thin” reports which connect to this single dataset from within Power BI Desktop.
- Close the Sales Analysis Dataset.pbix file.
- Create 2 copies of the Sales Analysis.pbix file as Internet Sales Analysis.pbix and Reseller Sales Analysis.pbix
- Open the Internet Sales Analysis.pbix file in Power BI Desktop and delete the Reseller Sales report page.
- On the Home menu, select Transform Data (Power Query).
- Delete the Warehouse and Parameters folders which will remove all data connections from the report.
- Select Close and Apply which will close the Power Query window. Notice that the report visuals are showing an error.
- On the Home menu, select Get Data > More > Power Platform > Power BI Datasets
- In the Select a dataset to create a report popup, search for the Sales Analysis Dataset. Notice that it states Promoted in the Endorsement column.
- Select the Sales Analysis Dataset and click Connect.
- The report should now show the visuals without error as we have connected the report to the dataset stored in the Power BI Service.
- Select Publish and publish to the Enterprise Reports Internet Sales Workspace.
Repeat the process above from the 3rd step using the Reseller Sales Analysis.pbix but delete the Internet Sales report page instead and deploy to the Enterprise Report Reseller Sales Workspace.
We have now separated the Power BI Desktop report into components which can now be reused. For example, the Promoted Dataset can be used to create new reports and the Dataflow can be used to create a new Dataset (and therefore data model).
Conclusion
In this blog post we have taken a single Power BI Desktop file and converted 3 main areas into separate components and deployed to the Power BI Service. This ensures that we are reducing duplication of effort, reducing strain on source data systems and that the overall Power BI architecture is more efficient.
Considerations
Dataflows can be set to a schedule to refresh. A Dataflow must be refreshed before any Dataset that uses it can be refreshed.
References
- https://businessintelligist.com/2020/07/09/how-to-switch-your-power-bi-table-to-a-different-data-source-type-without-breaking-anything/
- https://www.youtube.com/watch?v=YWp4FKzIBxM
- https://aka.ms/PBIEnterpriseDeploymentWP
- https://docs.microsoft.com/en-us/power-bi/transform-model/dataflows/dataflows-introduction-self-service