** Update **
On February 27th 2023 Microsoft announced that Power BI Streaming Dataflows would be deprecated. Read more here. The crux is that the GUI-driven functionality has made its way into Azure Stream Analytics, so this functionality in Power BI Dataflows becomes redundant.
If you are looking for streaming solutions into Power BI then look at Azure Stream Analytics for this, here is a link to a tutorial
Original Blog
Microsoft recently released Power BI Streaming Dataflows into public preview (July 2021 – read more here) which allows building a real-time data streaming reporting solution using Azure Event Hubs and Azure IoT as the real-time message sources and Power BI Dataflows as the storage and processing engine. With Streaming Dataflows we are able to capture streaming data and connect Power BI Desktop (and deploy to the Power BI Service) to visualise that data. With the Auto Page Refresh feature available in Power BI Desktop and the Service we are able to see real-time data as it is processed by the Streaming Dataflow.
There are 2 storage methods available within a Streaming Dataflow: hot and cold. Hot storage is by default set to 7 days retention and retains the latest data processed by the Streaming Dataflow, we can change this to a minimum of 24 hours. Once that threshold has passed then data is removed from hot storage. Note that the Streaming Dataflow needs to be active for this process, if it’s inactive then data will stay in hot storage until activated. All data is stored in Cold storage. We are able to access both storage types with Power BI Desktop/Service, Cold storage is import-only whilst Hot storage can be accessed using DirectQuery (for real-time) and import.
In this blog post we’ll be building an end-to-end streaming solution which uses a C# application to generate and send JSON “web visit” messages to an Azure Event Hub. We’ll then create a Streaming Dataflow connected to this Azure Event Hub and define processing logic. We’ll then connect Power BI Desktop to the Streaming Dataflow to visualise the data, and finally publishing to the Power BI Service.
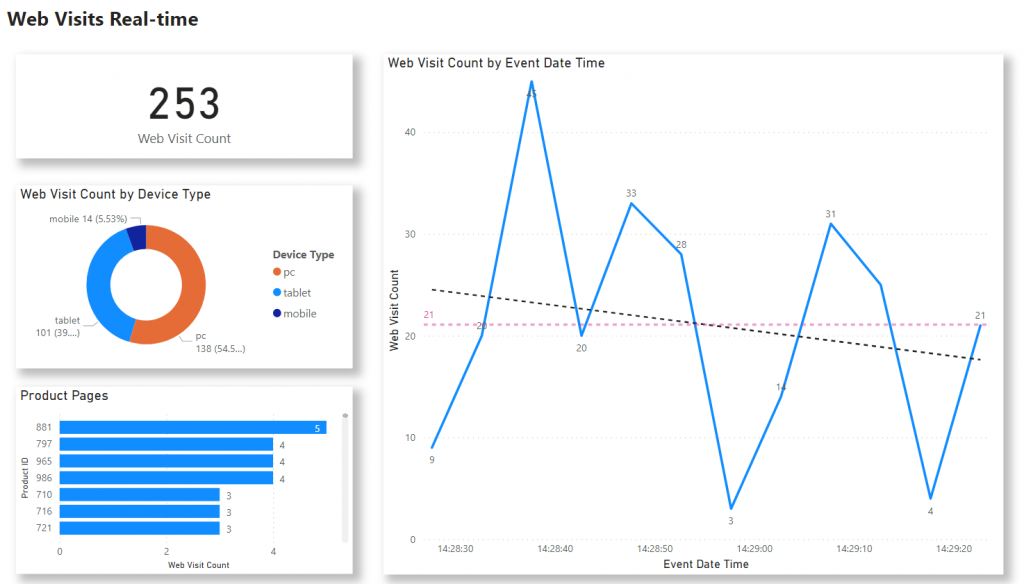
The following image is an example of the report we will be creating.
Solution Video
The following short video shows the solution running, from the C# app sending messages to the Power BI report visualising that data.
There will be a follow-on blog published at a later date in which we’ll dive a little deeper into the hot and cold storage concepts, the windowing settings in the Streaming Dataflows logic, and pausing/resuming the Streaming Dataflow.
Blog Summary
- Basic Solution Architecture
- Code Artefacts
- Prerequisites
- Create Azure Event Hub Resources
- Creating Source JSON Event Generator
- Create Power BI Streaming Dataflow
- Connecting Power BI Desktop to Streaming Dataflow
- Power BI Service Deployment & Configuration
- Conclusion
- References
Basic Solution Architecture
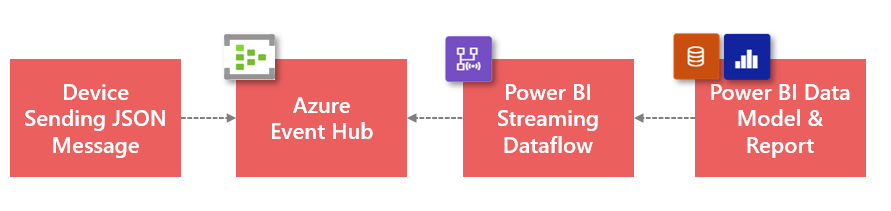
The following diagram shows a basic architecture to deliver a real-time event reporting solution.
- A source device generates a JSON-based event message and send to the Azure Event Hub
- The Power BI Streaming Dataflow connects to the Azure Event Hub to get the messages as they are received by the Event Hub
- The Power BI Data Model/Report connect in DirectQuery to the Streaming Dataflow to visualise the messages.
Code Artefacts
All code to create the solution is on GitHub here.
Prerequisites
To follow along and create the end-to-end solution, the following is required:
- Ability to run the C# application (Visual Studio)
- Access to create an Azure Event Hub
- Power BI Premium, Premium Per User or Embedded A3 tier.
Create Azure Event Hub Resources
We’ll start by creating a new Azure Event Hub as we’ll need the connection string and credentials of the new Event Hub for the C# JSON message generator app.
- Login to https://portal.azure.com
- Search for “Event Hubs” and select the Event Hubs service
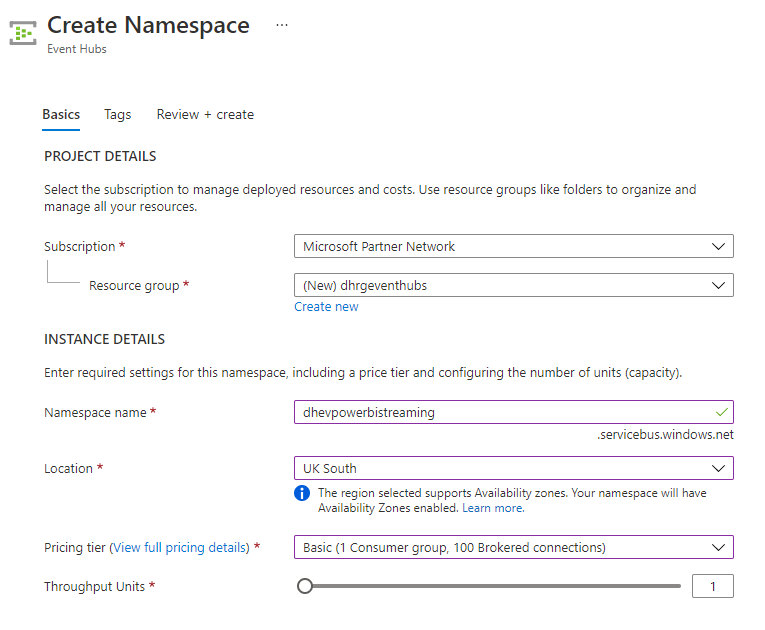
- Click Create and enter the following information
- Select appropriate Subscription
- Select or create a Resource Group
- Enter a Namespace Name
- Select an appropriate Location
- Select Basic for the Pricing tier
- Keep Throughput Units at default value of 1
- Click Review & Create
Once the Event Hub namespace has been created we now need to create an Event Hub.
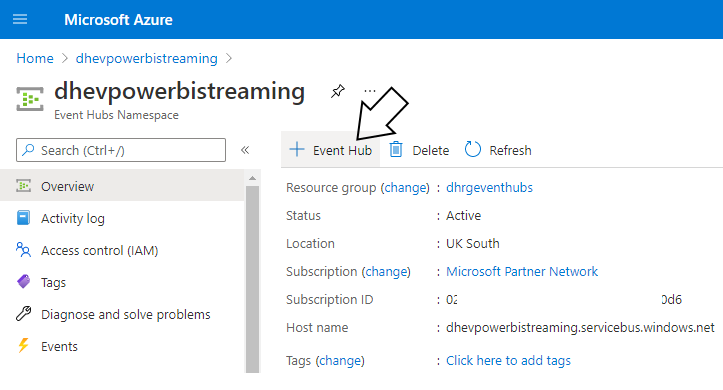
- Browse to the newly created Event Hub namespace
- Click + Event Hub in the Overview area
- Enter a name for the Event Hub such as dhevpowerbi
- Keep Partition Count to default value of 2
- Click Create
Once the Event Hub has been created and is active we need to create Send and Listen policies to allow the C# app to send JSON messages and the Power BI Streaming Dataflow to get the messages.
- Browsing to the Event Hub namespace
- Click Shared Access Policies under the Settings area
- The will be an existing policy called RootManageSharedAccessKey, we’ll create a new policy however
- Click + Add and enter an appropriate name such as SendEventsPolicy
- Enable Send and then save.
- Click + Add and enter an appropriate name such as ListenEventsPolicy
- Enable Listen and then save.
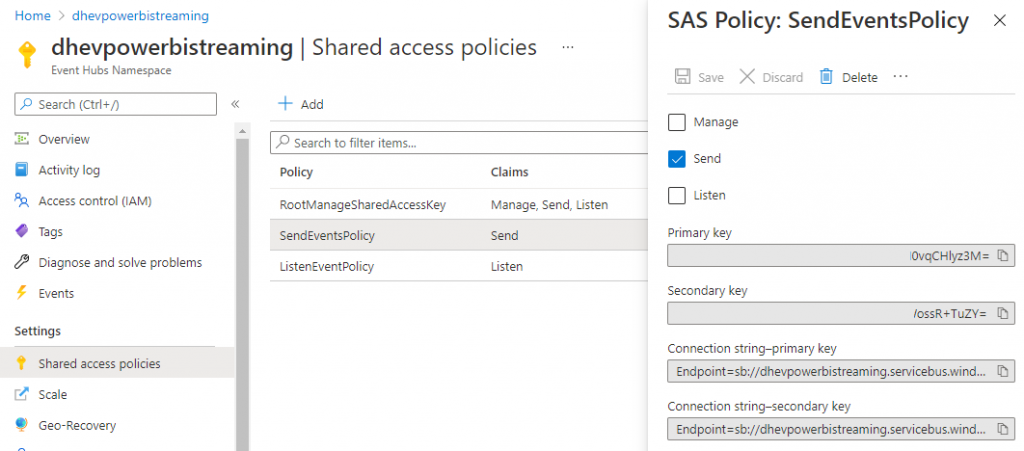
Take note of the values in the Connection string-primary key field as this will be used in the C# app and Streaming Dataflows as the connection string.
Please note that you can enable/disable the Event Hub. You will not incur any charges if the Event Hub is disabled.
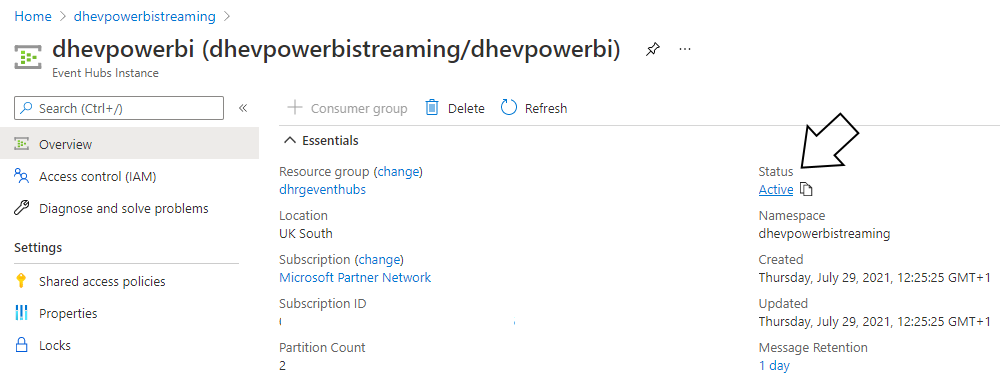
Now that the Event Hub has been created and is active, it is ready to receive messages from the C# app.
Creating Source JSON Event Generator
We’ll be using a C# application to create a series of JSON messages and post to the Event Hubs service. The C# app generates synthetic web visit JSON data which contains a set of fields to track a user session, the type of web visit (visitwebsite or browseproduct), datetime of the web visit, and the product the user browsed if the event type is browseproduct.
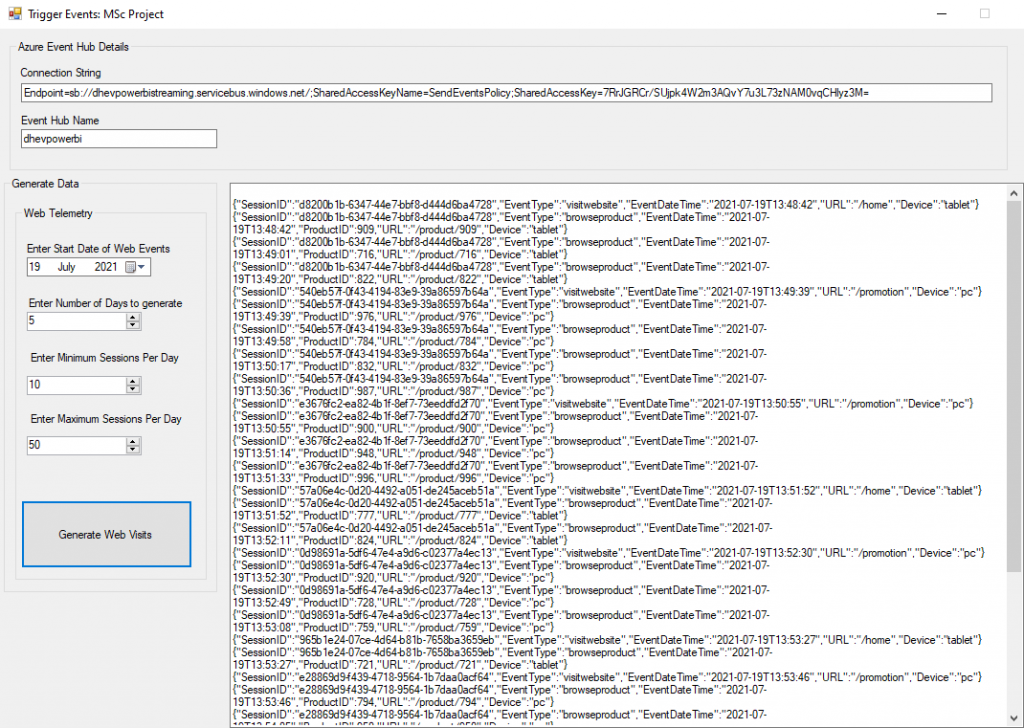
The properties of the C# app are as follows:
- 2 textboxes Connection String and Event Hub Name to add in the Event Hubs connection string and name
- A Date picker to select a “starting” date that we would like our events to be generated from
- A Number of Days we would like to generate events for
- A Minimum and Maximum number of sessions to generate each day. This will then generate a random session count per day within the boundary.
A snippet of the code to construct the JSON message and send to the Event Hub is as follows:
| //create the message structure | |
| WebVisitMessage webvisitmessage = new WebVisitMessage | |
| { | |
| SessionID = SessionID, | |
| EventType = "visitwebsite", | |
| EventDateTime = dateincrement, | |
| URL = URL, | |
| Device = device | |
| }; | |
| //serialize the JSON | |
| string outputwebvisitmessage = JsonConvert.SerializeObject(webvisitmessage); | |
| //send to the Azure Event Hub | |
| await using (var producerClient = new EventHubProducerClient(connectionString, eventHubNameWebVisits)) | |
| { | |
| using EventDataBatch eventBatch = await producerClient.CreateBatchAsync(); | |
| eventBatch.TryAdd(new EventData(Encoding.UTF8.GetBytes(outputwebvisitmessage))); | |
| await producerClient.SendAsync(eventBatch); | |
| } |
By running the app and entering appropriate information, the following can be seen:
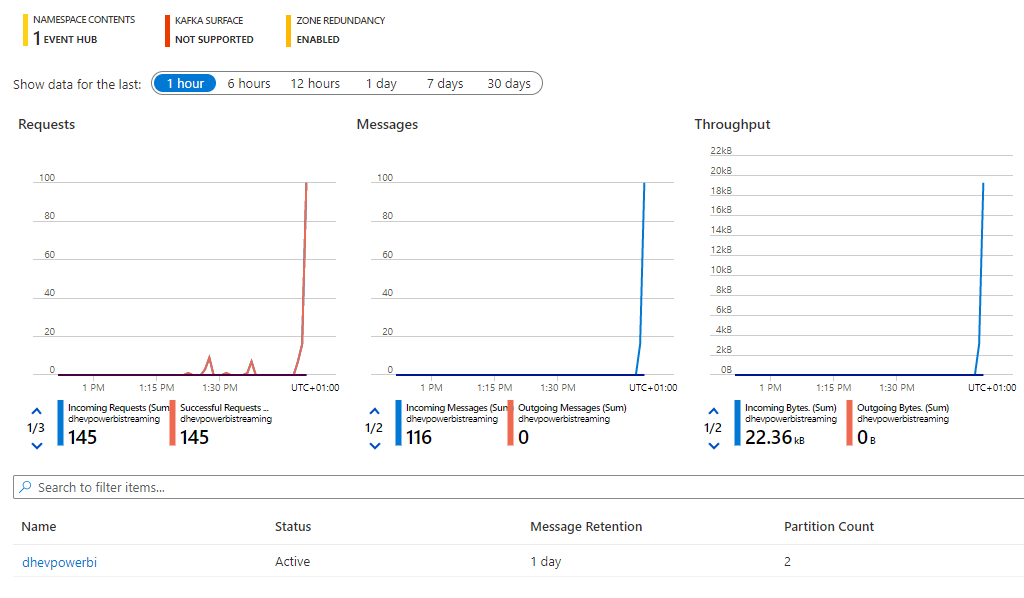
We can then check the Azure Event Hub to see if messages are being received:
Once we have successfully seen messages being received we can now create the Power BI Streaming Dataflow.
Update: Visual Studio Code Version
There is a Visual Studio Code version of the app available, details are here. This version removes the visitwebsite EventType.
Create Power BI Streaming Dataflow
We’ll now create the Streaming Dataflow which involves creating a new workspace assigned to a premium licence, creating a Streaming Dataflow and defining the logic required for receiving, processing, and saving the messages.
Create new Premium Workspace and Streaming Dataflow
- Login to https://app.powerbi.com
- Create a new Workspace called Streaming Dataflows
- Ensure the workspace is allocated to a Premium licence. In this example the new workspace is allocated to the licence mode – premium per user
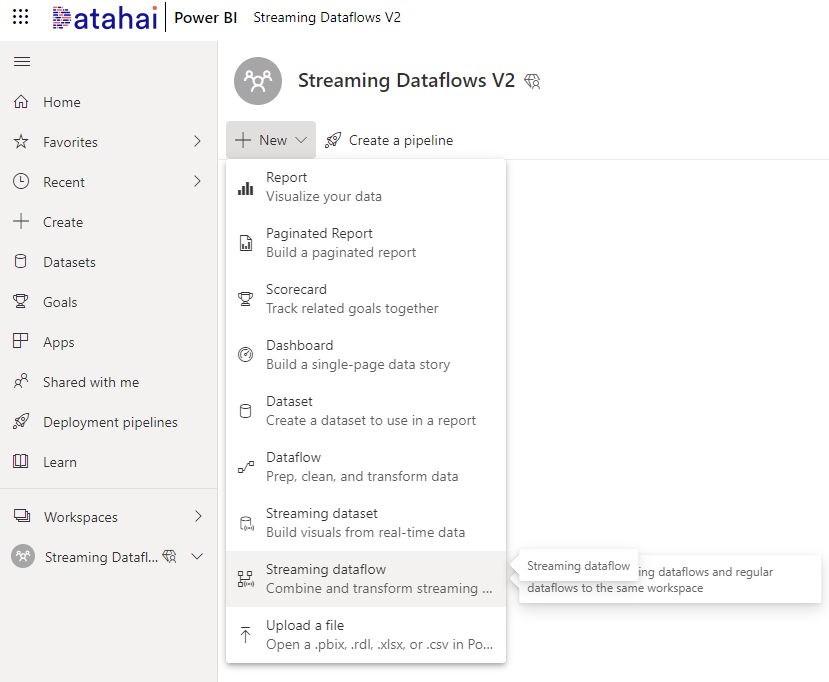
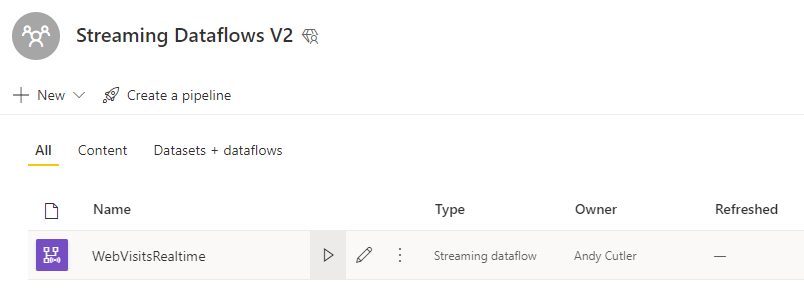
- Once created, enter the workspace and click + New > Streaming Dataflow
- Give the new Streaming Dataflow a name such as WebVisitsRealtime
- Click Create
Once the new workspace and Streaming Dataflow has been created, we must now define the input, processing logic, and output.
Define Streaming Dataflow Logic
We’ll now create processing logic that will connect to the Event Hub, split the message types into 2 streams, then join the 2 streams together to create a single output.
- Click Event Hub on the menu bar at the top and select Manual entry
- Event Hub Name: dhevpowerbi (or the Event Name you specific)
- Event Hub Endpoint (namespace): sb://dhevpowerbistreaming.servicebus.windows.net/
- Event Hub shared access key name: ListenEventsPolicy
- Event Hub shared access key: value from the Primary key field of the ListenEventsPolicy policy.
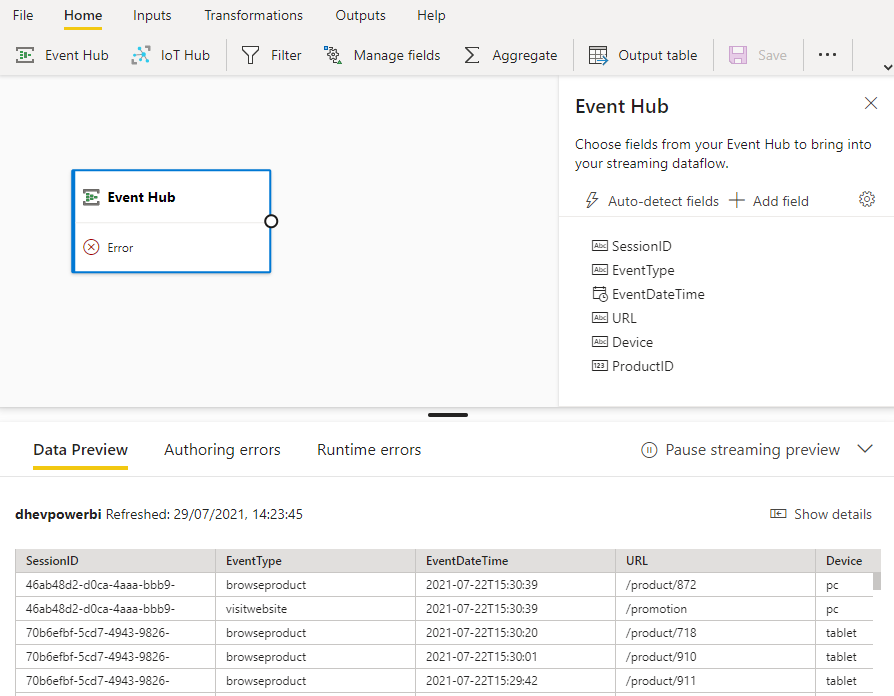
- Once created, click the Auto-Detect Fields button
- Run the C# message generator and generate web visit events.
- We should now see the fields available and a preview of the data.
- By hovering over the EventDateTime field and clicking the ellipsis, we can change the data type to Datetime
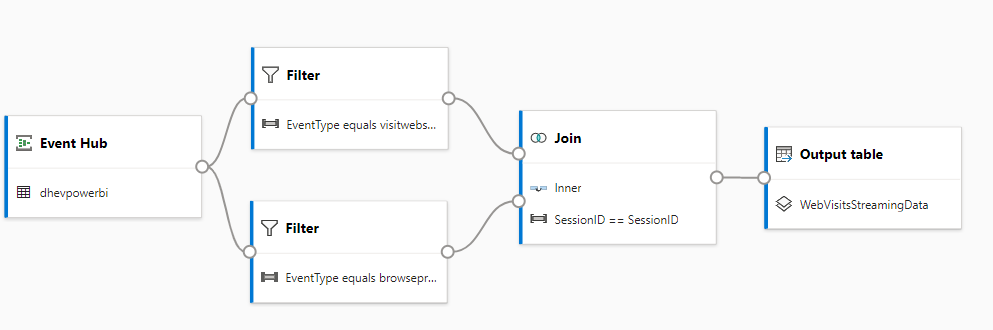
We’ll now define the processing logic as follows:
- Filter
- EventType = visitwebite
- Filter
- EventType = browseproduct
- Join
- Left: SessionID
- Right: SessionID
- Join Type: Inner
- Join all events within the last: 30 seconds
- Output table
- Name: WebVisitsStreamingData
Click Save once all processing logic has been created.
We can now go back to the Workspace and start the Streaming Dataflow. Once the Streaming Dataflow has started, run the C# app to generate JSON messages which will now be processed.
Connecting Power BI Desktop to Streaming Dataflow
Now that the Streaming Dataflow has been started and is receiving messages, we can now open Power BI Desktop and connect to the Streaming Dataflow to create a report.
- Open Power BI Desktop
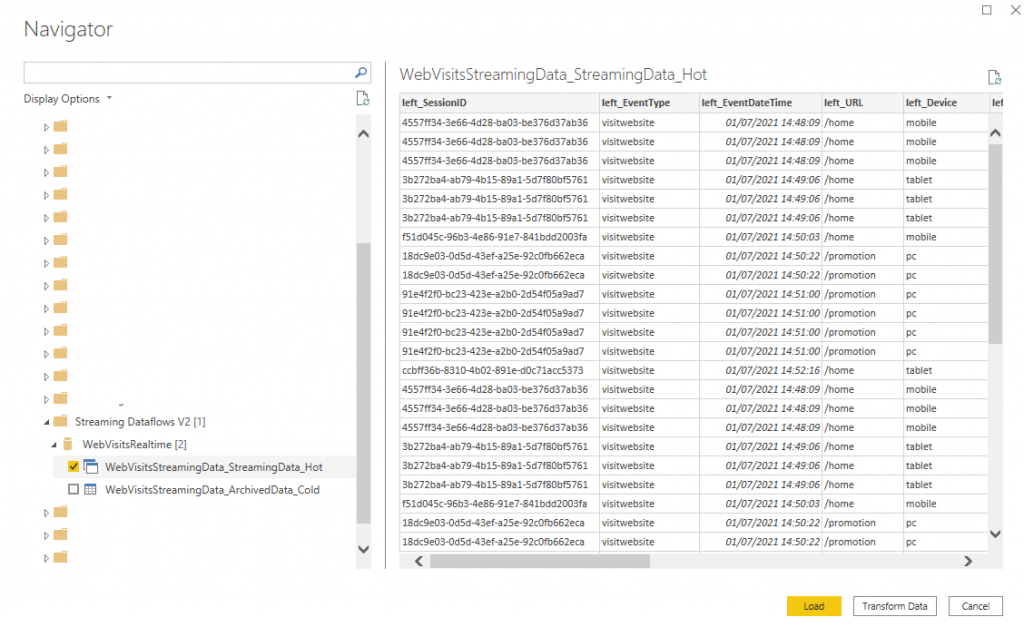
- Click Get Data and connect to Power Platform Dataflows (beta)
- Expand Workspaces > workspace name (Streaming Dataflows) > WebVisitsRealtime > hot table
- Click Transform Data
- Remove the following columns:
- left_EventType
- right_eventType
- left_EventDateTime
- left_Device
- left_ProductID
- right_SessionID
- Rename columns as follows:
- left_SessionID: Session ID
- left_URL: Main URL
- right_EventDateTime: Event Date Time
- right_URL: Product URL
- right_Device: Device Type
- right_ProductID: Product ID
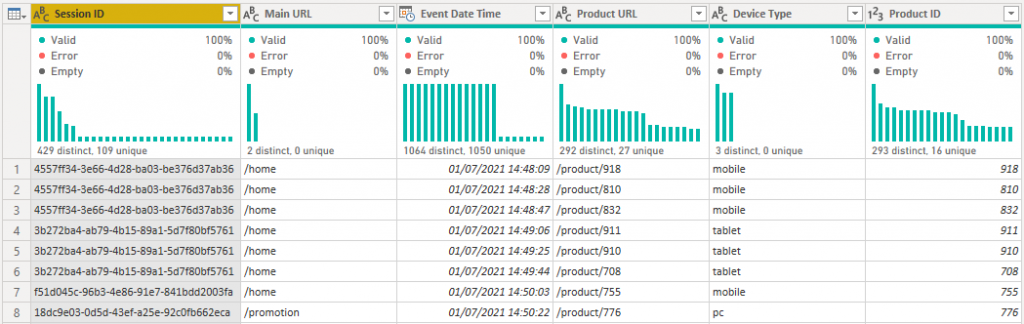
- Name the query Web Visits Realtime
- The Power Query window should show the following
- Click Close & Apply and when prompted to Set Storage Mode, select DirectQuery
When the Power Query window is closed, do the following on the report canvas.
- Select the Product ID field and set the Summarization to Don’t Summarize
- Create a New Measure called Web Visit Count with the DAX code defined as:
Web Visit Count = COUNTROWS('Web Visits Realtime')We can now create visualisations to show the streaming data.
- Add a Card visual and use the Web Visit Count measure
- Add a Donut Chart with:
- The Web Visit Count measure in Values
- Device Type in Legend
- Add a Clustered Bar Chart with:
- The Web Visit Count measure in Values
- Product ID in Axis
- Add a Line Chart with:
- The Web Visit Count measure in Values
- Event Date Time on Axis
- Ensure the Format > X Axis > Type is set to Continuous
Once we have built this report we can enable the Auto Page Refresh feature to show real-time data as it is being processed.
- In the Format pane for the report, switch the Page Refresh toggle to On
- Expand Page Refresh and set:
- Refresh Type: Auto page refresh
- Refresh this page every: 1 Second
The report will now refresh the visuals every 1 second to show any new streaming data.
Power BI Service Deployment & Configuration
Once the Power BI Desktop report has been created, we can publish to the Power BI Service to share with others.
- Publish the Power BI Desktop file to either the workspace with the Streaming Dataflow in or another Premium-licenced workspace.
Configure Auto Refresh on Power BI Tenant
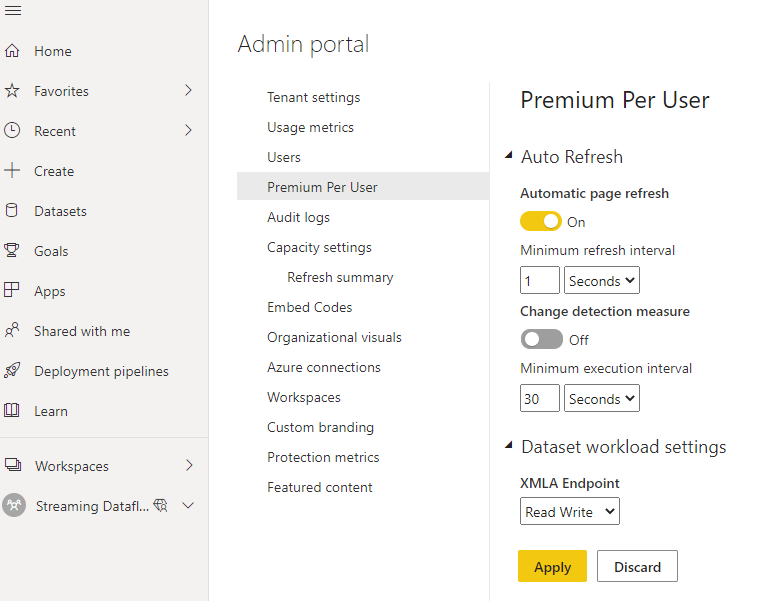
We must now change the Auto Refresh settings if we wish to enable a faster refresh cadence. In this scenario we are using the Premium Per User licence mode, therefore within the Admin Portal under the Premium Per User settings we can change the refresh interval to another value. In this case, 1 Second.
Configure Auto Refresh on Power BI Report
Once the Admin settings have been configured, we must check/change to ensure the report is set to the refresh interval we want.
- Open the report in the Service and click Edit
- On the Format pane ensure Page Refresh is enabled
- Expand Page Refresh and ensure that:
- Refresh Type: Auto page refresh
- Refresh this page every: 1 Second
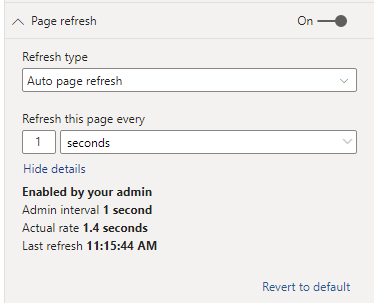
By clicking Show details we can see statistics about the refresh interval to ensure it matches with our settings. In this image we can see that the Admin interval is correctly showing our Admin configuration setting on 1 second.
Conclusion
In this blog we have created an end-to-end streaming data solution using a C# app to generate synthetic web visit data, send that data to an Azure Event Hub, create a Streaming Dataflow within Power BI to pull messages from the Event Hub, and created a Power BI report to visualise the data. In the follow-up blog we’ll look at data retention and what happens when the Streaming Dataflow is paused then resumed.
Switch Off Resources
To switch off the Streaming Dataflow, click the Stop Dataflow icon when hovering over the Dataflow name in the Power BI workspace. To switch off the Event Hub, browse to the Event Hub within the Azure portal and click the Status link (which will be showing as Active) and set to Disabled.